
One of the most important blogging tools I use (and that I consider to be vital for every blogger) is Google Analytics, a free application that allows you to track your visitors and understand their behavior.
This post will act like a blogger’s guide to installing and using Google Analytics so that you can get the most out of it and truly understand your readers.
Why do you need to track your visitors?
Although this might sound a bit creepy, tracking your visitors is super important! Not only because you know how many of them you have and what your most popular posts are, but because Google Analytics helps you understand their behavior and that can help you tweak your blog so you get the best results going further.
💎 Here are a few things that you can track once you have installed Google Analytics:
- Page views & unique users (per total and per page)
- Location, age, sex and user’s interest
- Behaviour (new or returning users, engagement, bounce rate)
- Referrals (where does your traffic come from)
And these are just a few! I am going to be focusing on the basic features that a blogger can use in their day-to-day lives, as there are a few advanced features that I don’t currently use. If there is anything else you would like to be included in this guide to Google Analytics, let me know in the comments section.

Want a full tutorial on Google Analytics and a step-by-step guide for bloggers on how to increase their page views? Check out my ebook above and grab a free sample chapter today!
How to install Google Analytics?
First off, to be able to install the application on your website, you need to be self-hosted. That means if you’re using the free version of WordPress for example, you will have to rely on their internal tracking plugins such as Jetpack as installing Google Analytics is not an option.
Blogger, on the other hand, allows you to install Google Analytics even if you’re not self-hosted, but for the purpose of this tutorial, I’m going to be demonstrating how to install it if you are a self-hostedWordpress blogger (that means you bought hosting but you installed WordPress to manage your website).
Read my post about What Is Hosting And Why You Need It here.
📃 STEP 1 – Create an account
To start using G.A. you first need to create an account with them. Simply go here > Sign In ( top right corner) > Analytics > Log In with your existent google account (or create a new one if you need to).
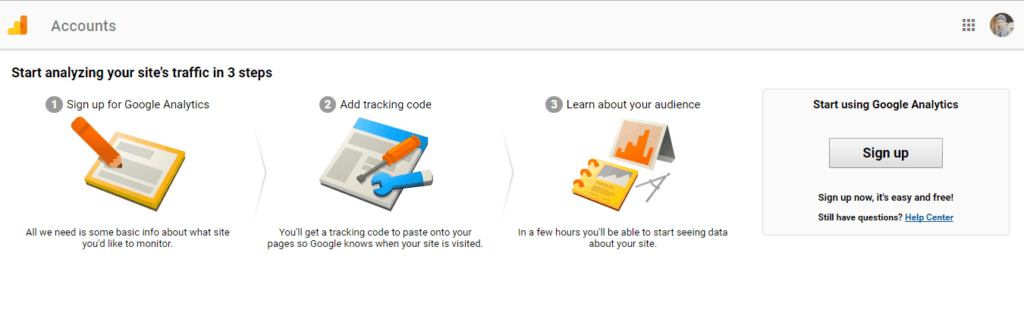
Once you are in, you’ll see a page that looks like the one blow. Click on the sign-up button and complete the form that pops up.
📃 STEP 2 – Generate your tracking ID
After you enter a few details about your website, scroll down to the bottom of the page where you will see a blue button that will generate your unique tracking ID.
📃 STEP 3 – Embed your tracking ID on your blog
What you need to do now is copy the generated tracking ID and embed it in the code of your website so that it appears on every page. Don’t worry, the code won’t actually appear, no matter where on the blog you decide to put it.
There are a few places you can paste your tracking id:
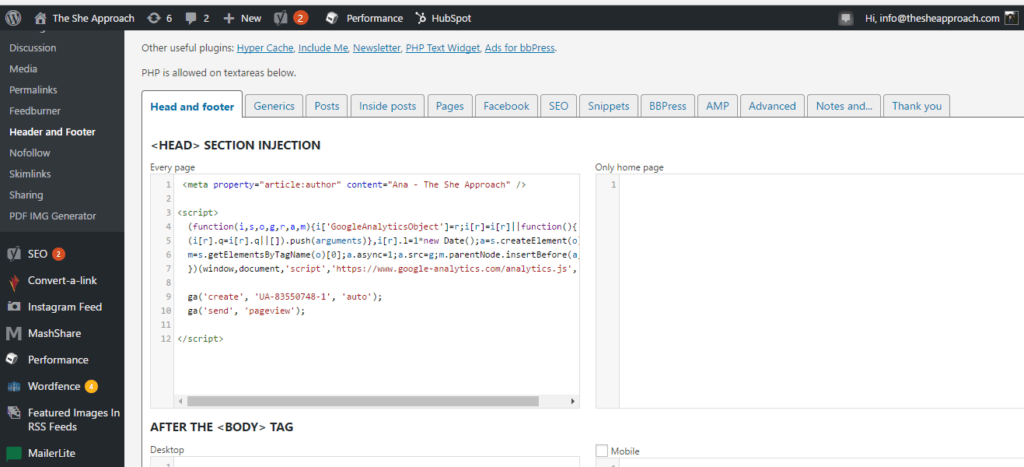
- In the header or footer of your blog. I did so by installing a WordPress plugin for headers & footers that allows me to add the code without messing with the HTML of the entire website. I promise this looks more complicated than it actually is, as all I had to do is go to my dashboard at the “Header & Footer” section and paste the tracking code.
- Search and install a Google Analytics plugin that will configure this for you.
- Create a text/HTML widget (one that appears on every page. If your sidebar is disabled on certain pages for example, this won’t work) and paste the code there. As I mentioned, this will simply appear blank to readers so there is no need to worry about aesthetics.
Make sure you only need to add your code once (adding it multiple time causes confusion and often false numbers).
How to use Google Analytics?
After your code is installed, it may take a few days for results to start showing on the Google Analytics dashboard as it starts tracking from the moment that you install it and cannot retrieve past information. (So if you don’t have it installed yet, make sure you do it as quickly as possible!)
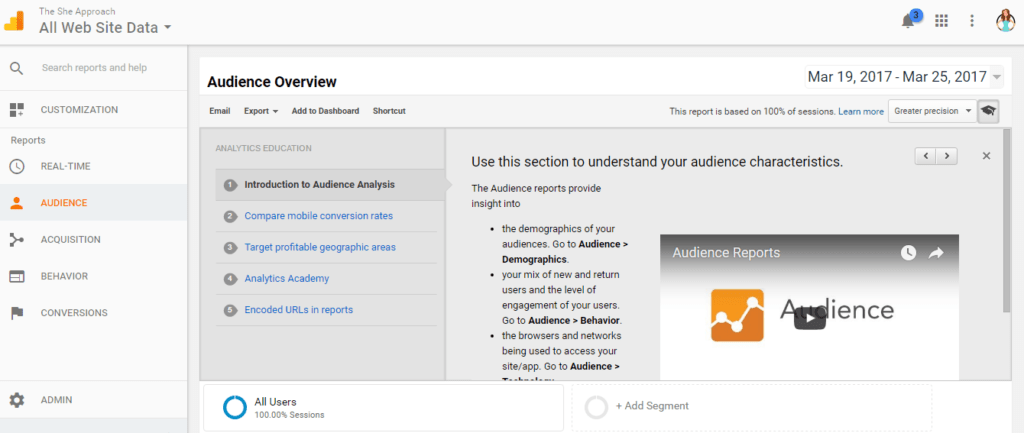
To view your data, you have to log in your dashboard first, which looks something like this:
They have a couple of explanatory video tutorials that will take you through the nitty-gritty details and that you should watch to get a basic understanding of how things work.
To navigate the platform we are going to use the 5 tabs in the left sidebar (Real-time, Audience, Acquisition, Behaviour & Conversions) and we’re going to select a period of time from the right side corner to decide what results we want shown in the first place (I went ahead and selected my first month of blogging).
You can select either a specific day, a period of time at your choice or “all-time” analytics.
💎 REAL TIME
The first tab is exactly what you would expect. This is not a feature I normally use but if you’re looking to find out how many visitors are on your page at a certain moment, you can check by clicking on this tab. This will also show you what page they are on, where they are from and how they got to your website.
💎 AUDIENCE
The audience tab has every information you could possibly wish to know about your blog visitors. By clicking on it a few sub-tabs will appear that will focus on different aspects of the readers such as sex, location or interest.
I usually check the “Overview” tab to see a resume of all the information I need:
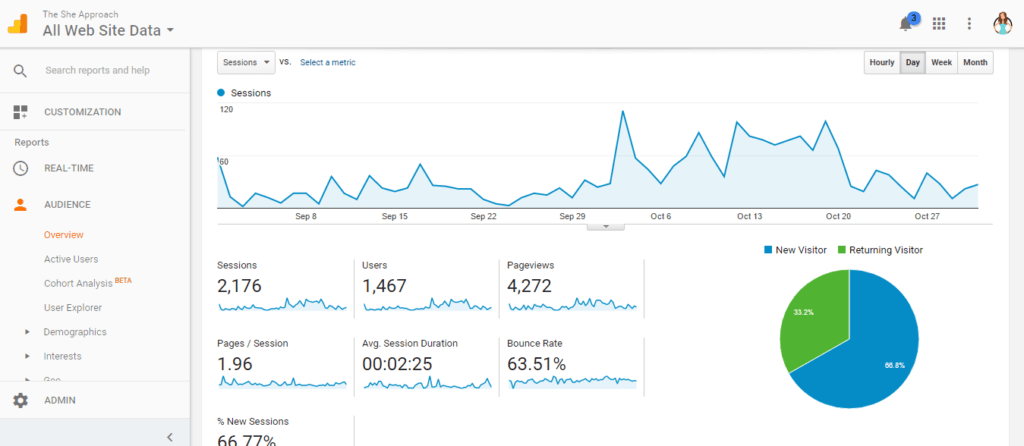
Depending on the time range you selected, this chart will show you the information relevant to that time. Here is what these things mean:
- Sessions are website visits. If someone comes to your website and spends 5 minutes on it and then leaves, that counts as a session. If he returns the next day and spends another 2 minutes, that counts as another session.
- Users are unique individuals that have been on your blog.
- Pageviews are the total of views your blog gets. If someone comes to your blog and looks at your homepage and three different articles, that will total in 4 pageviews.
- Pages / Session is the average of pages a user sees in a session. So if A comes to your website and checks out 4 pages and B checks out 2 pages, the average of pages per session is 3. You normally want this number to be as high as you can because that means people are not just leaving after checking out an article.
- Avg. Session Duration is the average of time a user spends on your website per session. Again, you want this to be as high as possible because it means people will actually spend time reading your posts.
- Bounce rate is the percentage of single-page sessions. This shows you how many people come to your website and only check out one page in their whole session. You want this to be as low as possible because that would mean that people are sticking around to see what else you got on your blog. A great bounce rate is in the range of 26 to 40 percent but anything over 70% is a cause of concern for bloggers.
- New sessions is an estimated average of new visits to your website.
If you scroll down you will see more information about the location of the users (per country or town), their browser or mobile systems used.
If you’re interested to know more about the visitors, you need to select “Demographics” and “Overview” from underneath the Audience tab.
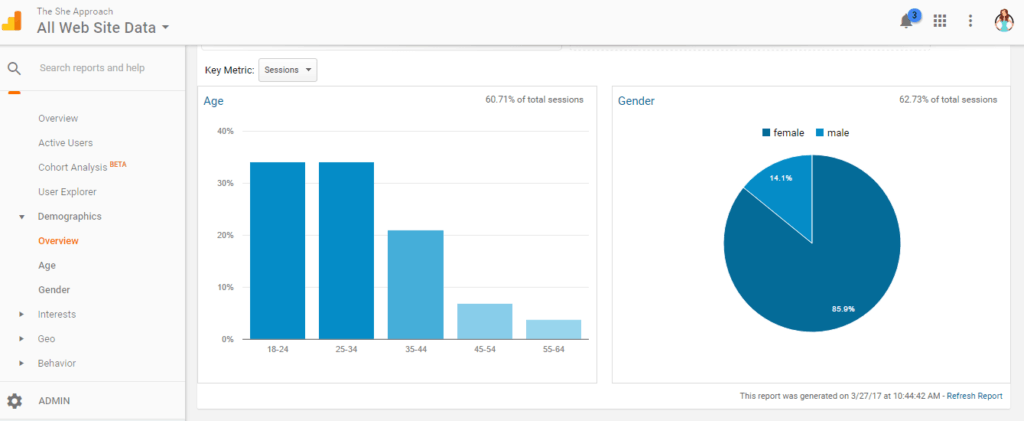
This will show you statics about the age and sex of your users, which can come in handy when you are writing new posts because you know who your most popular audience is.
If you’re out of ideas for what to post, I suggest going to your “Interests” tab to find out what topics are relevant to your readers. You will be surprised of how detailed the information there is.
💎 ACQUISITION
This is one of my most checked tabs because I’m always interested to know what brings people over to my website, what promotional efforts pay off and where I can improve.
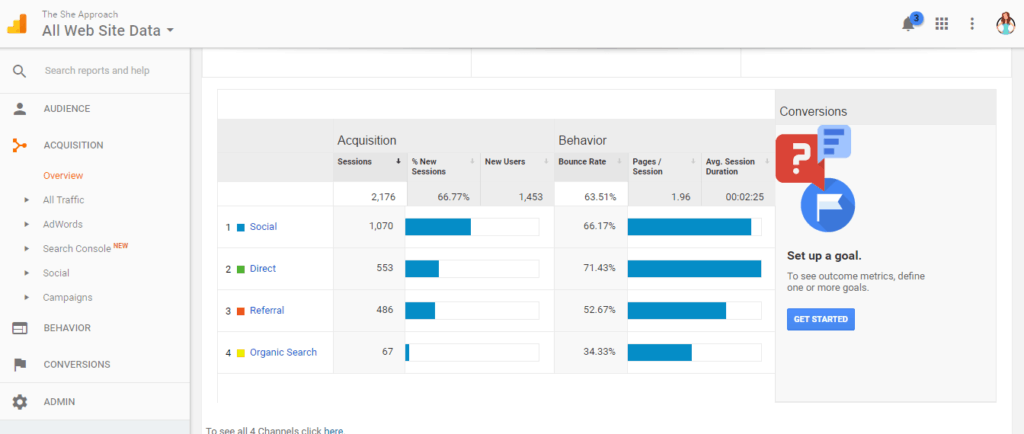
- Social is where all the traffic coming from social media platforms shows. If you click on it, it will show you in detail what traffic each platform sent your way and all the information about the audience that I talked about earlier such as page views, bounce rate and percentage of new users. This can be a real eye opener because you get to see how valuable your traffic sources are.
- Direct will show you how maybe people put in your URL and what pages they went to,
- Referral is where all the traffic that is referred from other blogs and sources is shown.
- Organic Search shows an overview of how many visitors you got based on search engines clicks.
💎 BEHAVIOR
This tab will give you more information about where your viewers spend their time when they come to your website. A really valuable tool found under this tab is the “Site Speed” one that shows you how much time does it take for your website to load and even suggests improvements to make to improve your site speed.
💎 CONVERSIONS
This is not a tab that I currently use but in comes in handy for those who want to track certain goals and make sure their visitors meet a certain target. I found that this is more useful for e-commerce platforms so I’m not currently using this feature.
Do you have Google Analytics installed? What is the most used feature for you?
Would love to hear your thoughts and questions in the comment section below.
What a super helpful breakdown! I’ll definintely pass this along.
♡ Cara
http://www.rootsbeforereach.com
Thank you so much Cara!
Really glad this was helpful!
Thank you so much!
Great summary for a very useful tool! I use it for my blogs although I would love a reliable system to get rid of those stupid spam traffic sources that doesn’t require me sitting there blocking every single one!!
Thank you so much! x
Thank you so much!
Really helpful post, especially because all of the Google Analytics jargon can really confuse me! Bookmarking this post for future use 🙂
Julia // The Sunday Mode
Hi Julia,
The terms can be confusing, but once you get the hang of them, you’ll be able to read your results like a pro!
Thanks so much for commenting! x
Thank you so much!
So helpful and most detail post I’ve seen on google analytics!
Thank you so much!! Really pleased this was detailed enough!
Thank you so much!
I’ve downloaded Header & Footer plug in and added the tracking code in the footer. It now appears in the left bottom corner when you open my blog. Is it how it should be?
Also, I did it on Wednesday afternoon, so do you think it’s enough time for Google Analytics to start working, because I’ve just logged in to my account and it doesn’t yet show anything.
Hi Joanna,
The code shouldn’t show at all on the website. It works like an embedded invisible code that neither you or your readers should see.
If that appears, you probably placed it in the wrong spot and that’s why your Analytics dashboard is not picking up and results.
Make sure to copy and paste the entire code and do so before the closing tabs of the footer.
Hope this helps.
I corrected one thing and it’s working now! Yay! Thank you for the useful post and showing everything step by step!
Such a helpful post, thank you!
My pleasure!
Thank you for this!!